What Pythagoras’ theorem can teach us about the Fed

All Insights

Currently reading

What Pythagoras’ theorem can teach us about the Fed

Investment Insights • Macro

2 min read

What Pythagoras’ theorem can teach us about the Fed

Pythagoras’ theorem — which states that the square of the hypotenuse equals the sum of the squares of the other two sides in a right-angled triangle — is not a standard tool in monetary policy. However, it does offer a surprisingly useful way to evaluate the Federal Reserve’s performance, as EFG’s Chief Economist Stefan Gerlach explores in this Macro Flash Note.

Unlike most central banks, the Fed has a dual mandate: to ensure price stability and to promote maximum employment. While many central banks also consider both inflation and economic activity, the Fed is unusual in that it assigns these goals equal importance.

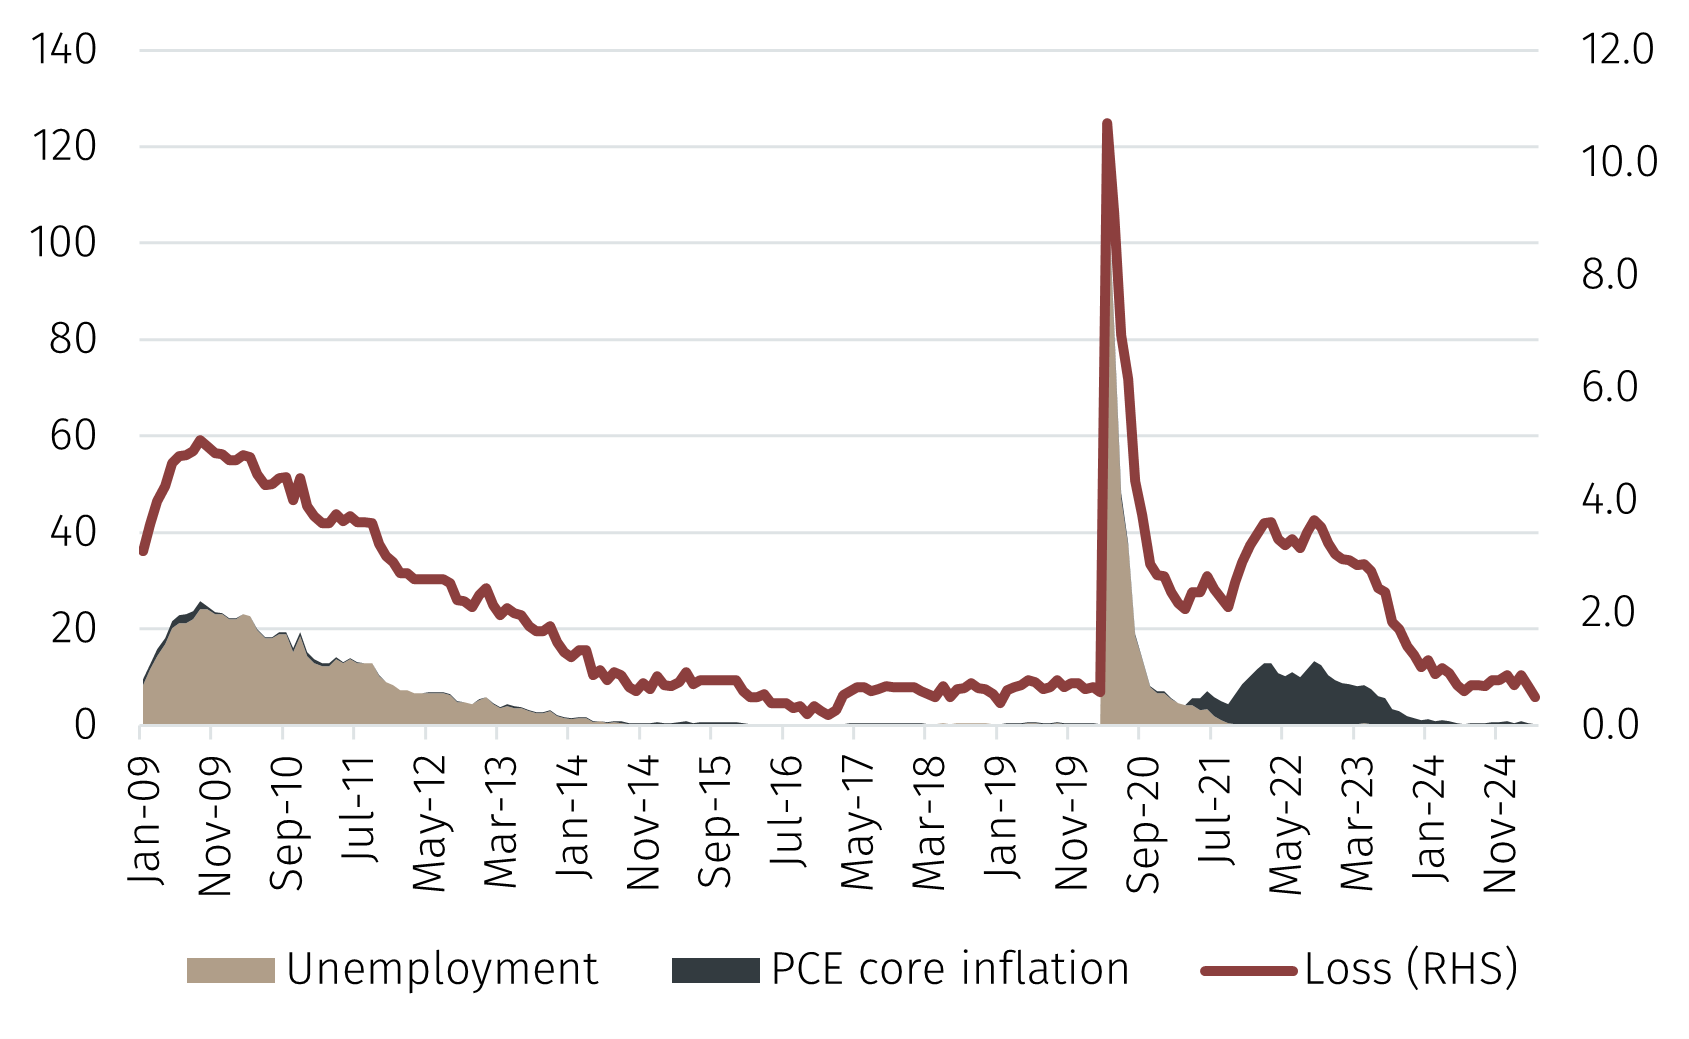
In practice, the Fed is often interpreted as seeking to minimise the squared deviation of core personal consumption expenditure (PCE) inflation from a 2% target and the squared deviation of unemployment from a “normal” level. This benchmark is typically taken to be the median of Federal Open Market Committee participants’ longer-run projections, most recently 4.2%. This “target” varies over time and is available quarterly since 2009Q1.1 

Formally, the Fed’s objective can be written as minimising a “loss function” of the form:

{(inflation rate – 2%)² + (unemployment rate – 4.2%)²} ¹ᐟ²

This loss function defines the hypotenuse of a “policy triangle,” which captures how far the Fed is from meeting its dual mandate. The smaller the hypotenuse, the better the Fed’s performance. Thus, this loss function provides a simple but powerful way to frame the trade-offs involved in monetary policy.

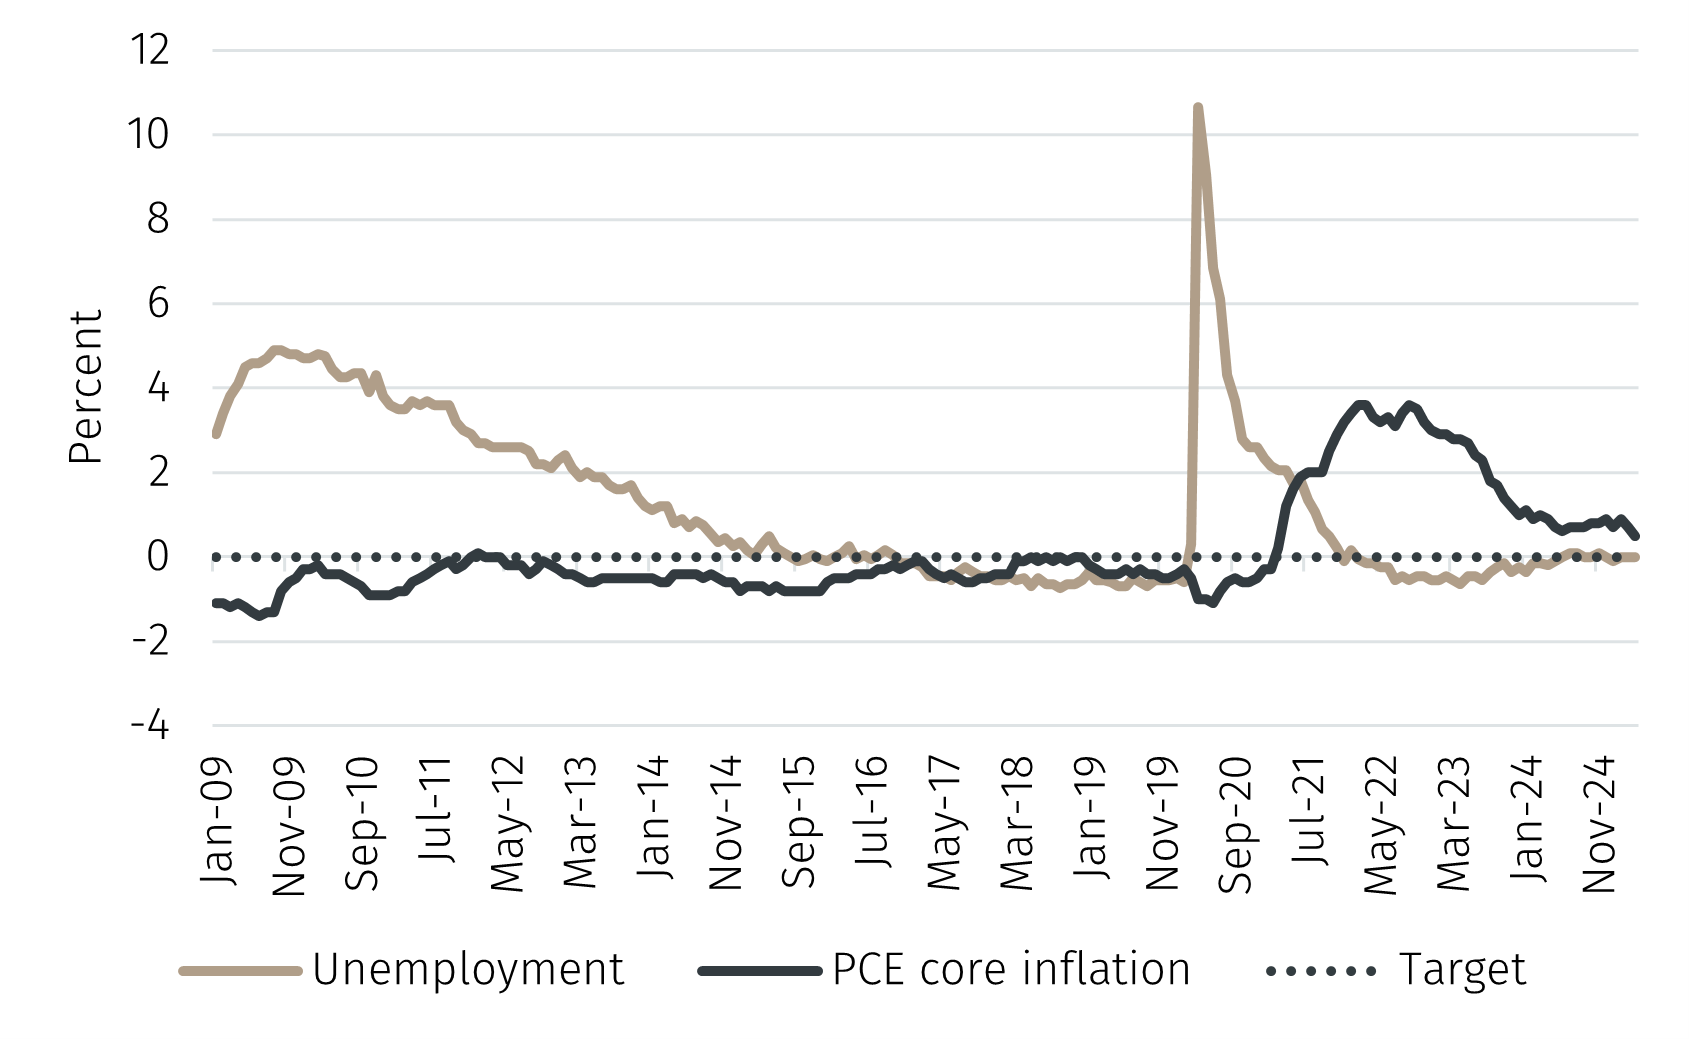
The graph below shows the deviations of unemployment target and core PCE inflation from 2% since 2009. Historically, the most important source of losses were spikes in unemployment — though these episodes have differed markedly in severity and duration.

Chart 1. Unemployment and inflation (deviations from target)

Pythagoras1.png

Source: Fred. Data as of 01 June.

The Global Financial Crisis triggered a sharp and prolonged increase in unemployment, with unemployment peaking at 10.0% in 2009. The Covid-19 pandemic led to a much more dramatic, albeit short-lived, surge, with the unemployment rate spiking to 14.8% in 2020 before falling rapidly as the economy reopened.

Inflation remained close to the 2% target for much of the 2000–2020 period. It rose sharply as the US economy reopened after Covid-19 in 2021, driven by a mix of strong demand, supply bottlenecks, and rising energy prices. These pressures intensified following Russia’s invasion of Ukraine in early 2022, which led to a further surge in energy costs. Since then, energy prices have fallen back, supply constraints have eased, and tighter monetary policy has helped inflation decline toward target.

The combination of above-target inflation and below-target unemployment suggests that monetary policy was too expansionary for some time. A tighter stance would likely have lowered inflation at the cost of somewhat higher unemployment.

The next graph plots the squared deviations of unemployment and inflation from target, along with the value of the loss function. Over the past 18 months, the loss has declined steadily as inflation has moderated. It is again apparent that, before the most recent period, most of the increases in the loss function has come from changes in unemployment.

Chart 2. Squared deviations and loss

Pythagoras2.png

Source: EFG calculations on data from Fred. Data as of 01 June.

While this approach is useful for assessing past policy performance, it is less useful for guiding future decisions. Because of the long lags in monetary transmission, the Fed must act based on forecasts rather than current outcomes. The policy triangle, in other words, helps explain where the Fed has been — but not where it will, or should, go next. 

Conclusion
Judging the Fed’s performance with help of Pythagoras’ theorem shows steady progress over the past year, as falling inflation has brought the economy closer to the Fed’s targets. However, past performance is not enough. With long and variable lags in monetary transmission, the real challenge for central banks always lies ahead.

1 The data are available as series UNRATECTMLR on Fred. The monthly observations have been set equal to the quarterly datapoints in order to render the data monthly.

Required

Required

Required

Required

Required

Required

Required

Please note you can manage your subscriptions by visiting the Preferences link in the emails you receive from us.

Required