All Insights

Currently reading

The eurozone credit drought

Investment Insights • MFN

4 min read

The eurozone credit drought

Flows of new credit to the private sector have collapsed since the European Central Bank started raising interest rates. In this Macro Flash Note, GianLuigi Mandruzzato looks at how eurozone bank lending flows are drying up and the implications for growth and inflation.

GianLuigi Mandruzzato

Monetary policy affects the business cycle with long and variable lags. Higher central bank interest rates increase the cost and reduce the availability of credit to the private sector, discouraging demand, slowing GDP growth and inflation. In a bank-centric system like the eurozone, bank lending flows to the private sector are therefore a good guide to how much monetary policy tightening has impacted the economy.

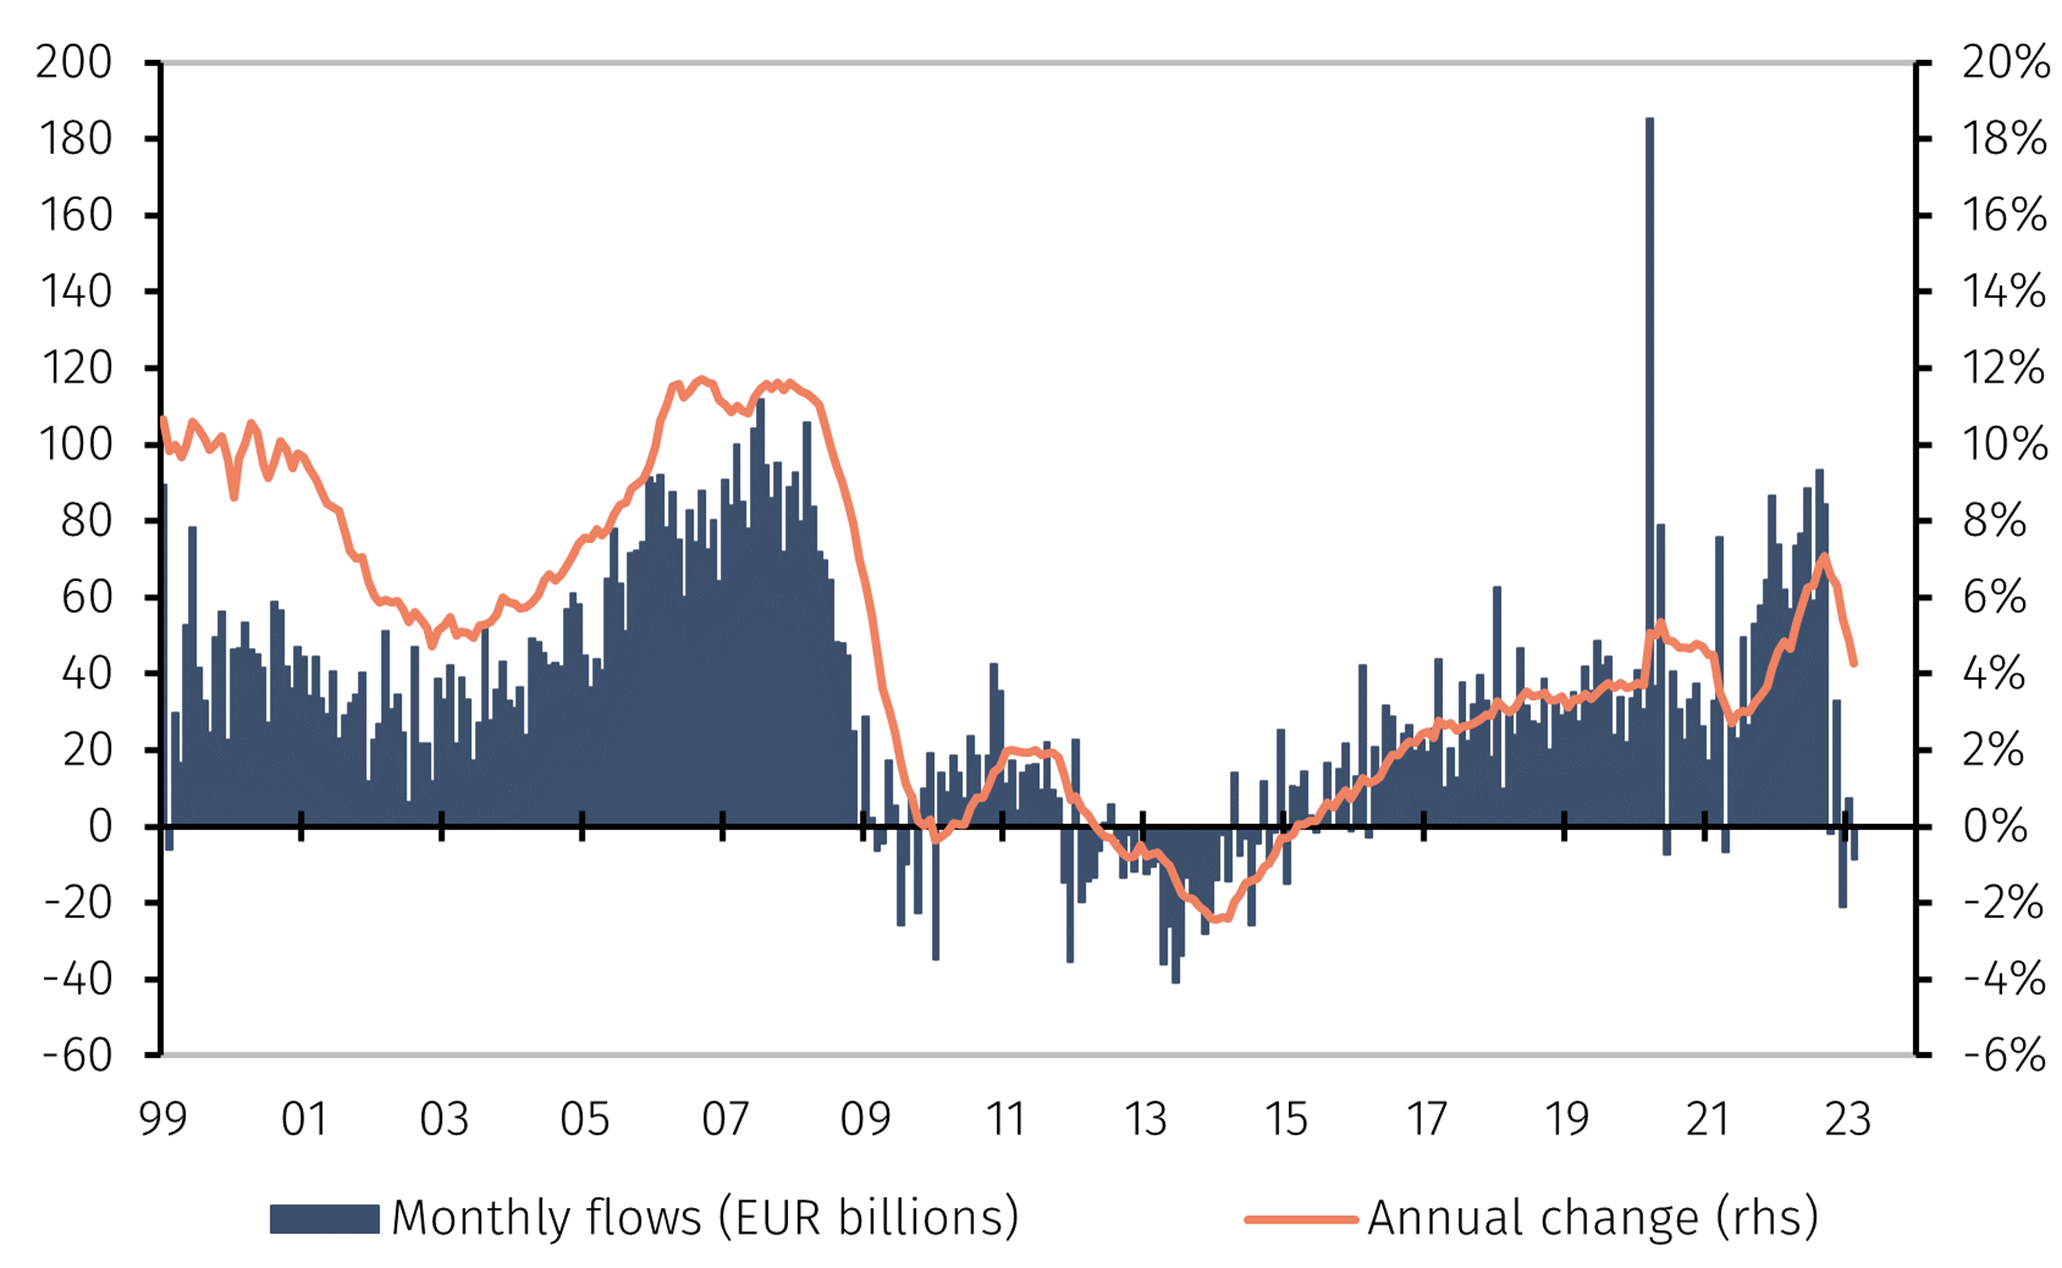
It is notable that net credit flows to the private sector collapsed as soon as the ECB raised its deposit rate above zero last September. In the October-February period, the monthly average of new loans was practically nil compared to about EUR75 bn in the first nine months of 2022 (see Chart 1). Even before the banking turmoil that erupted in March, eurozone credit flows had already evaporated, raising the risk of a full-blown credit crunch. 

Chart 1. Eurozone bank loans ex-securitisation 

eurozoneCreditDrought_1.png

Source: ECB, Refinitiv and EFGAM calculations.

The decline in new credit granted could be due to a drop in demand or to a more cautious approach to lending by banks. The ECB's Bank Lending Survey suggests that both factors are at work and these trends are likely to strengthen in the coming months due to the recent instability in the global banking sector.1

Weak net credit flows to the private sector are a headwind for GDP growth. The credit impulse, defined as the ratio between the annual difference in net credit flows and the nominal GDP of a year earlier, is strongly correlated with the annual growth of real GDP. The drying of credit flows there points to a sharp slowdown in GDP growth in 2023 (see Chart 2). 

Chart 2. Eurozone credit impulse and GDP growth

eurozoneCreditDrought_2.png

Source: ECB, Refinitiv and EFGAM calculations.

The credit impulse also shows a high correlation with changes in annual HICP core inflation (see Chart 3).2 Periods of weak or negative credit impulse are followed by periods of declining inflation, and vice versa. Again, the slump in the eurozone credit impulse since last October suggests that the core inflation rate will slow down substantially in 2023.

Chart 3. Eurozone credit impulse and core inflation

eurozoneCreditDrought_3.png

Source: ECB, Refinitiv and EFGAM calculations.

The ECB has indicated that it will also consider financial data in determining monetary policy. At the next meeting on 10 May, the Governing Council will have available data on credit flows for the month of March, which should reflect the first effects of the turbulence in the banking sector. If the new data on eurozone bank lending are perceived as raising the risk of a credit crunch, a moderation, if not a pause, in the ECB’s monetary policy tightening would be appropriate.


1 See EFG Macro Flash Note – Tight lending standards cloud the growth outlook, 23 February 2023.
2 In the 2002Q1-2019Q4 sample period, the correlation coefficient between the 2-quarter average of the credit impulse, lagged by one quarter, and real GDP annual growth was 0.87. In the same sample period, the correlation between the 2-quarter average of the credit impulse, lagged by four quarters, and the annual change in the HICP core inflation rate was 0.52.

Required

Required

Required

Required

Required

Required

Required

Required