What Pythagoras’ theorem can teach us about the Fed

All Insights

Currently reading

US CPI: A notable absence of tariffs

Investment Insights • Macro

2 min read

US CPI: A notable absence of tariffs

The US consumer price index (CPI) release on 12 August was greeted with relief by markets, precipitating a rally in equity markets. At the same time the probability of a Fed rate cut when the Federal Open Market Committee (FOMC) next meets in September increased from about 85% immediately prior to the release to about 95% immediately after. In this Macro Flash Note, Deputy CIO Daniel Murray highlights some interesting features of the data that suggest pre-Trump inflation trends remain intact for the time being, despite tariffs.

The recent US CPI release was in-line with expectations, delivering a monthly increase in the CPI of 0.2% and a year-over-year (YoY) change of 2.7%, the same as the previous month. The core index, which excludes food and energy, increased by 0.3% in July and by 3.1% over the past year, up from 2.9% in June. The positive equity market reaction was in part driven by the belief that this release solidifies the likelihood that the Federal Reserve will cut rates in September. Was that reasonable?

Sub-components
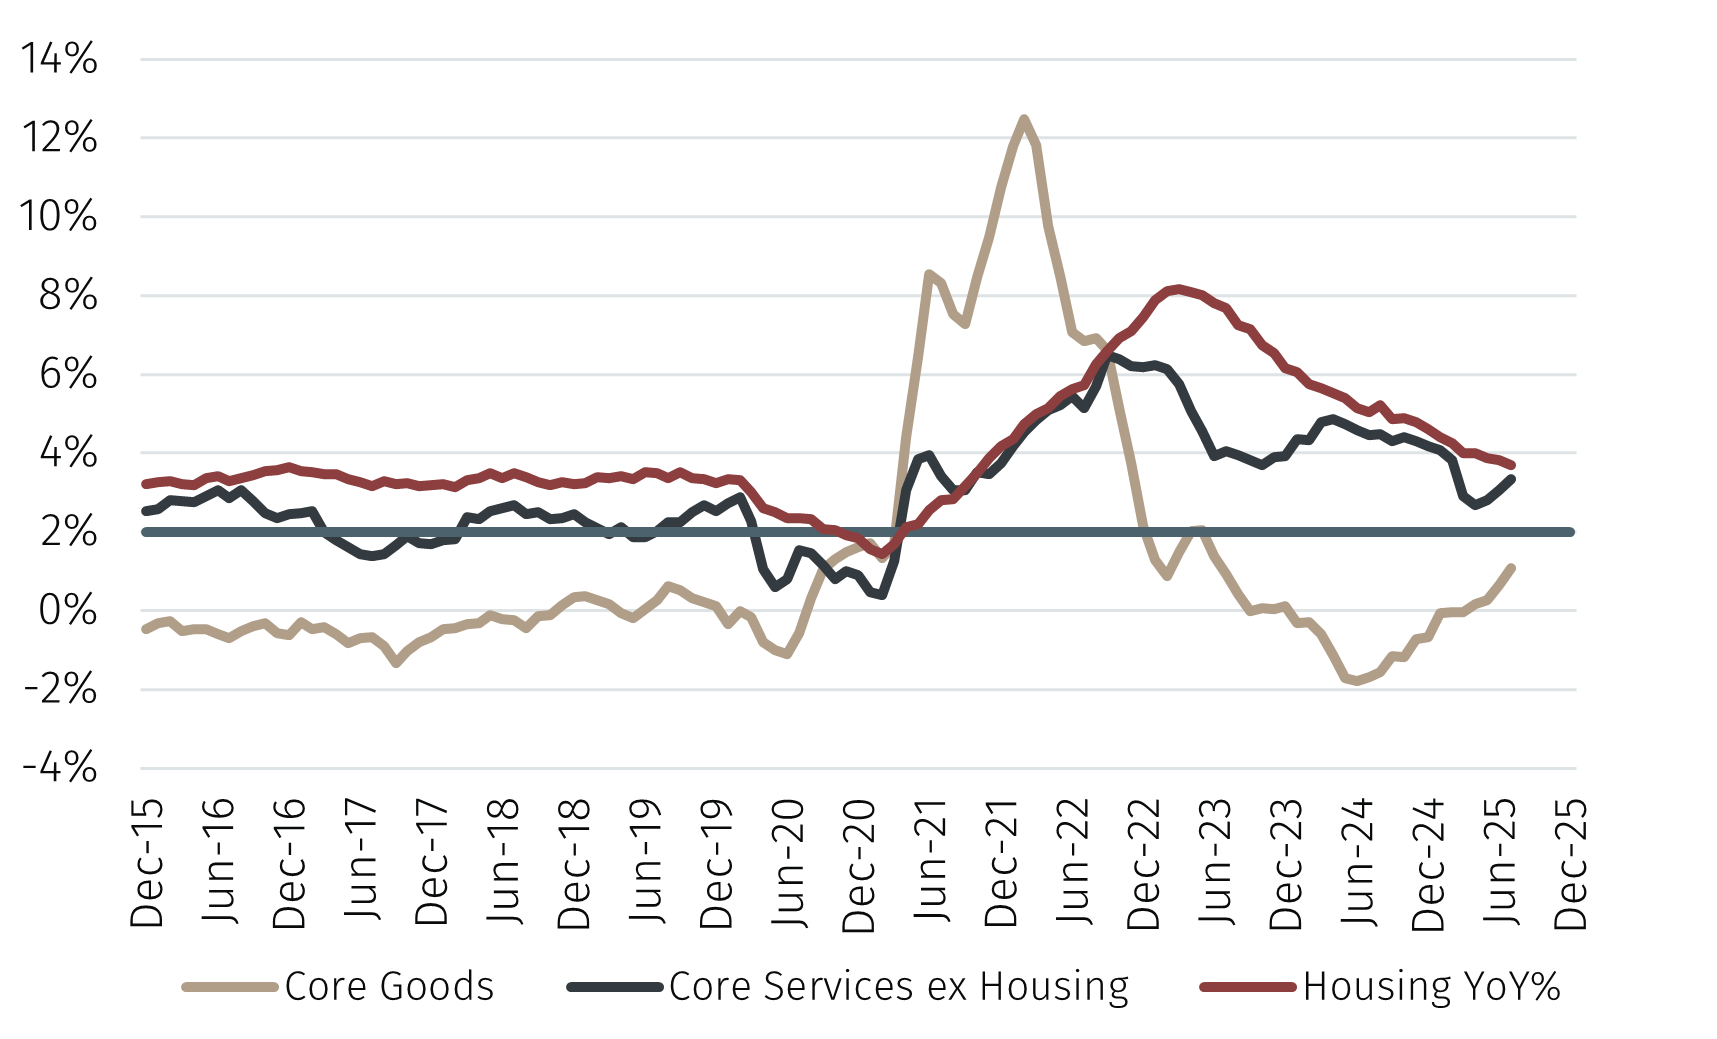
Looking at the sub-components of the CPI shows that core services ex-housing inflation increased from 3.0% year-over-year in June to 3.2% in July. This was offset by a slight decrease in housing inflation from 3.8% year-over-year last month to 3.7% in July.

Chart 1 – US core CPI components YoY%

Tariffs1.png

Source: Bureau of Labor Statistics, EFG calculations. Data as at end July.

Core goods inflation (goods excluding food and energy) remains low but has been increasing steadily since the middle of last year. From a low of -1.8% in June last year, the year-over-year percentage change in that component increased to 1.1% in the most recent release. This is the highest it has been in over two years, as shown in Chart 1.

Time scale
It is customary to look at changes in prices over 12 months as a good indicator of underlying inflation. This has some advantages. It dampens short term volatility that results from looking at changes over shorter time periods and it also helps to account for seasonality since a comparison is made with the same month in the prior year. However, one disadvantage is that it places equal weight on all observations, including those that are relatively old.

Chart 2 – US core CPI components, 6-month annualised % change

Tariffs2.png

Source: Bureau of Labor Statistics, EFG calculations. Data as at end July.

An alternative approach is to look at inflation over shorter time periods. For example, taking six-month annualised percent changes in the core components of the US CPI tells a markedly different story. On this basis core services ex-housing inflation declined to 1.9%, its sixth consecutive monthly decline from a peak of 4.8% in January of this year. Similarly, housing inflation declined to 3.0% from 3.3% in June and core goods inflation declined to 1.1% from 1.3% in June, as shown in Chart 2. This presents a much more positive story, suggesting that underlying inflation trends remain in decline.

Impact of tariffs
Media headlines have been dominated this year by tariffs. That is understandable given the profound shift in global trade dynamics that the Trump administration’s policies portend. Some commentary has suggested that the recent increase in year-over-year goods inflation is the result of tariffs. Whilst this may be partly true, there is no discernible difference between the rising trend in goods inflation that has been in place for the past 12 months and the behaviour of that index since tariffs were announced, as shown in Chart 1.

Furthermore, there is no evidence that any of the subcomponents of the goods CPI have yet experienced any uplift in recent months. This may change in the months ahead as companies adjust to the new trade arrangements but it is not yet visible in the data, as reflected in Chart 3.

Chart 3 – US CPI components month-over-month %

Tariffs3.png

Source: Bureau of Labor Statistics, EFG calculations. Data as at end July.

Conclusions
Analysing recent inflation data suggests that there has so far been no discernible impact from tariffs. Whilst there has been a recent increase in year-over-year inflation rates, this is consistent with the usual month-to-month variation in the data. Shorter term trends indicate that inflation pressures have abated over the past six months whilst subcomponent analysis also shows that there are no causes for concern at present. That the July CPI release was positively greeted by markets therefore seems rational in the context of the shorter-term trends and the behaviour of the subcomponents.

Whether or not tariffs eventually put upward pressure on inflation remains to be seen, although there will likely be some offset from weaker energy prices, as we highlighted in a previous report.1 The next important inflation update is the personal consumption expenditure data due on 29 August. We will be watching that and other news flow for any signs of tariffs pushing through to pricing, although our base expectation is that this will be much less than had been feared. In our view, this should clear the path for the Fed to cut rates in September and at least once more before year end.

Obligatoire

Obligatoire

Obligatoire

Obligatoire

Obligatoire

Obligatoire

Obligatoire

Obligatoire

Please note you can manage your subscriptions by visiting the Preferences link in the emails you receive from us.

Obligatoire